Visual Analytics and Visual Data Discovery
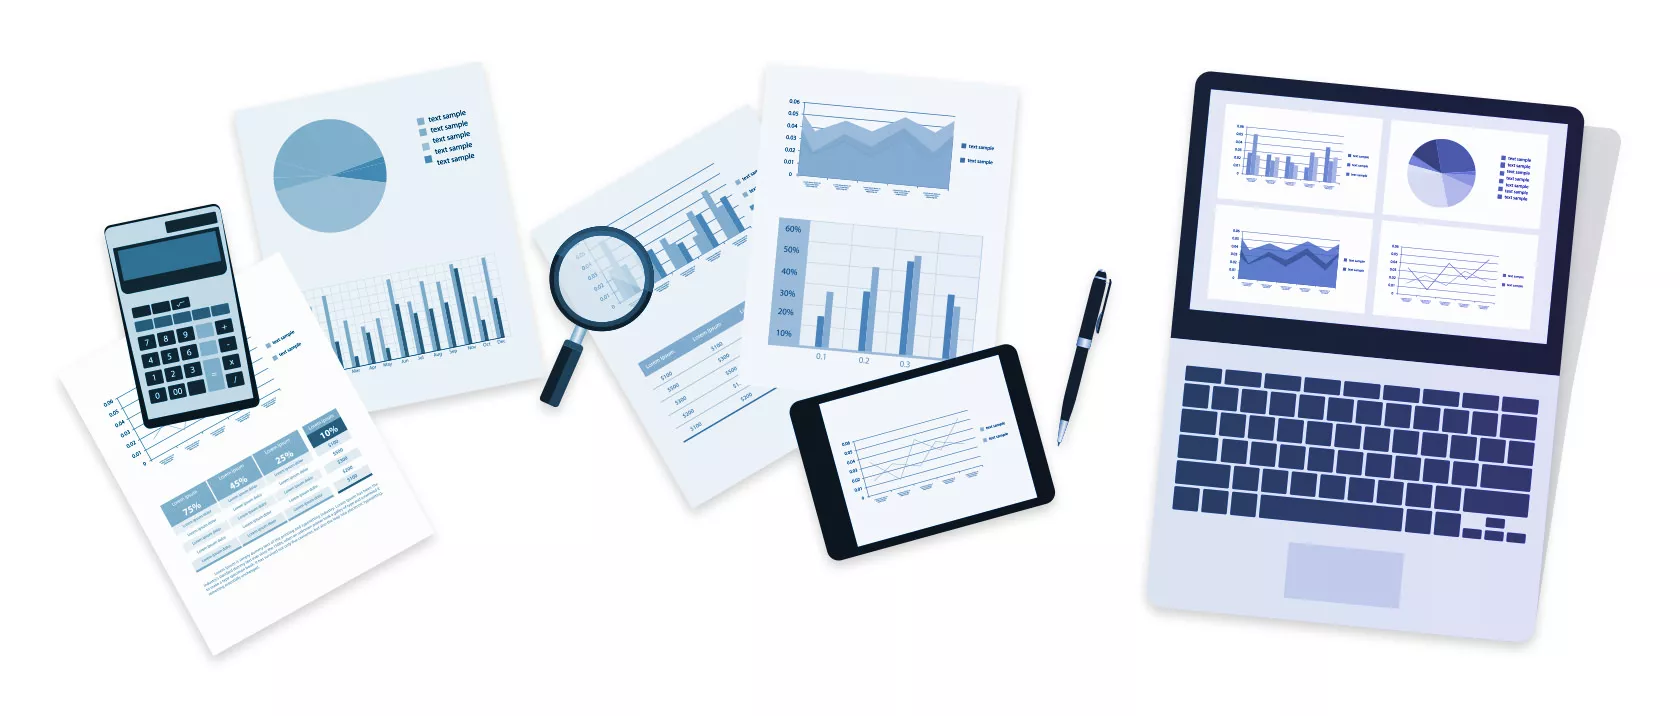
Visual analytics and data discovery software empower specialists, statisticians, data scientists, and employees in your enterprise’s marketing and sales departments to effectively visualize all company data in the form of graphs, diagrams, and interactive dashboards. This makes it easy to recognize complex correlations and trends, and explore them interactively. Moreover, this class of tools is especially user friendly and quick to set up. Our specialists would be pleased to guide you on all aspects of visual analytics, mobile BI, and self-service BI.
Visual Data Discovery
Visual analytics and visual data discovery encompass all visualization techniques to present large volumes of data in a simplified manner. Predictions made from the data analyses facilitate your enterprise’s business-centric decision processes. Generally, you can use such tools on-premise in your computing center, or from a cloud. Easy to set up, these tools help you resolve legacy systems that have generally mushroomed, are often too static, user-unfriendly, and/or highly labor intensive. Users will benefit from the expanded and interactive functions of the new software, which delivers professionally produced data and reports.
Visual analytics delivers more than just a report
Visual analytics differs clearly from conventional reporting, because of the human factor. Both visual analytics and visual data discovery apply diverse technologies to coalesce the strengths of automated data analysis with the forte of humans, namely the human ability to recognize correlations and patterns.
The emphasis of visual analytics is, hence, no longer on the small circle of report recipients, but instead on the active user. This person is the one who uses Internet platforms and mobile media to research and analyze information via user-friendly, intuitive interfaces, and to communicate with other users. Such ease of use is made possible by adapting diverse visual analytics technologies.
These systems often have in-memory technologies that respond rapidly without tedious modeling, and thus facilitate real interaction with the data. The user is free to choose filters, make selections for analysis, and navigate through the data. Therefore, IT developers no longer need to anticipate all kinds of scenarios and build them into the software. On the contrary, they simply apply coherent data models to define a framework within which users can operate.
Self-Service BI
As a result of this development, the compilation of analyses, dashboards, and reports has shifted chiefly to technical departments. Hence, most users can operate without the IT unit, within the scope of self-service BI systems. Business analysts often function as power users, because of their specialized technical knowledge. They are consequently cut out to develop and deliver interactive applications for other specialist users.
Our partner network in the field of visual analytics


Information and Numbers on your Fingertips with Mobile BI
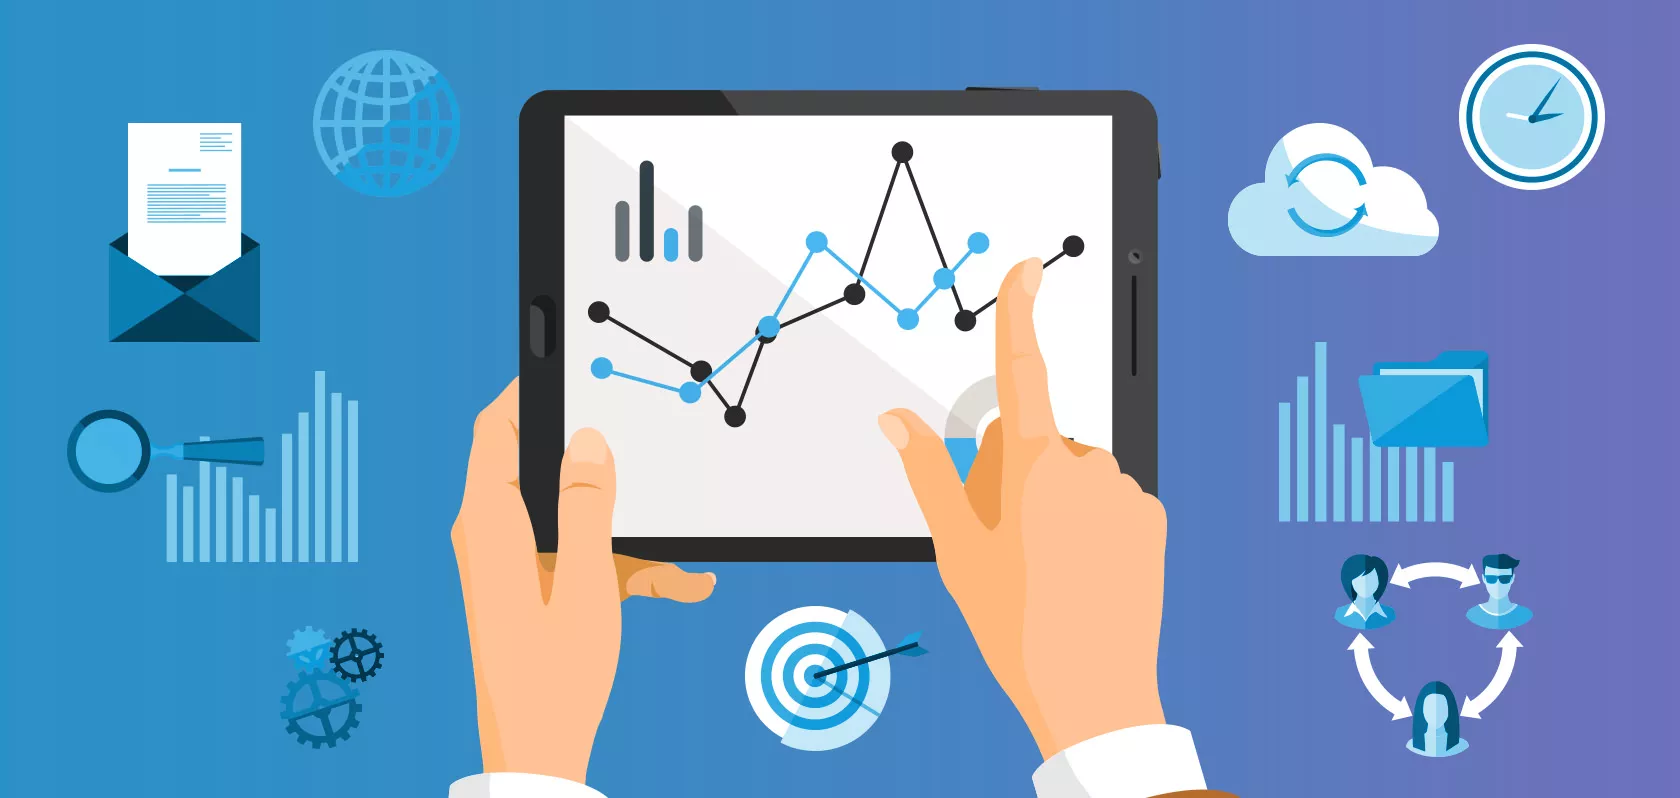
With a mobile BI service, all the BI information is handy, at all times. Senior management, sales, and marketing staff can look up easy to interpret, interactive analyses and thereby make intelligent decisions.
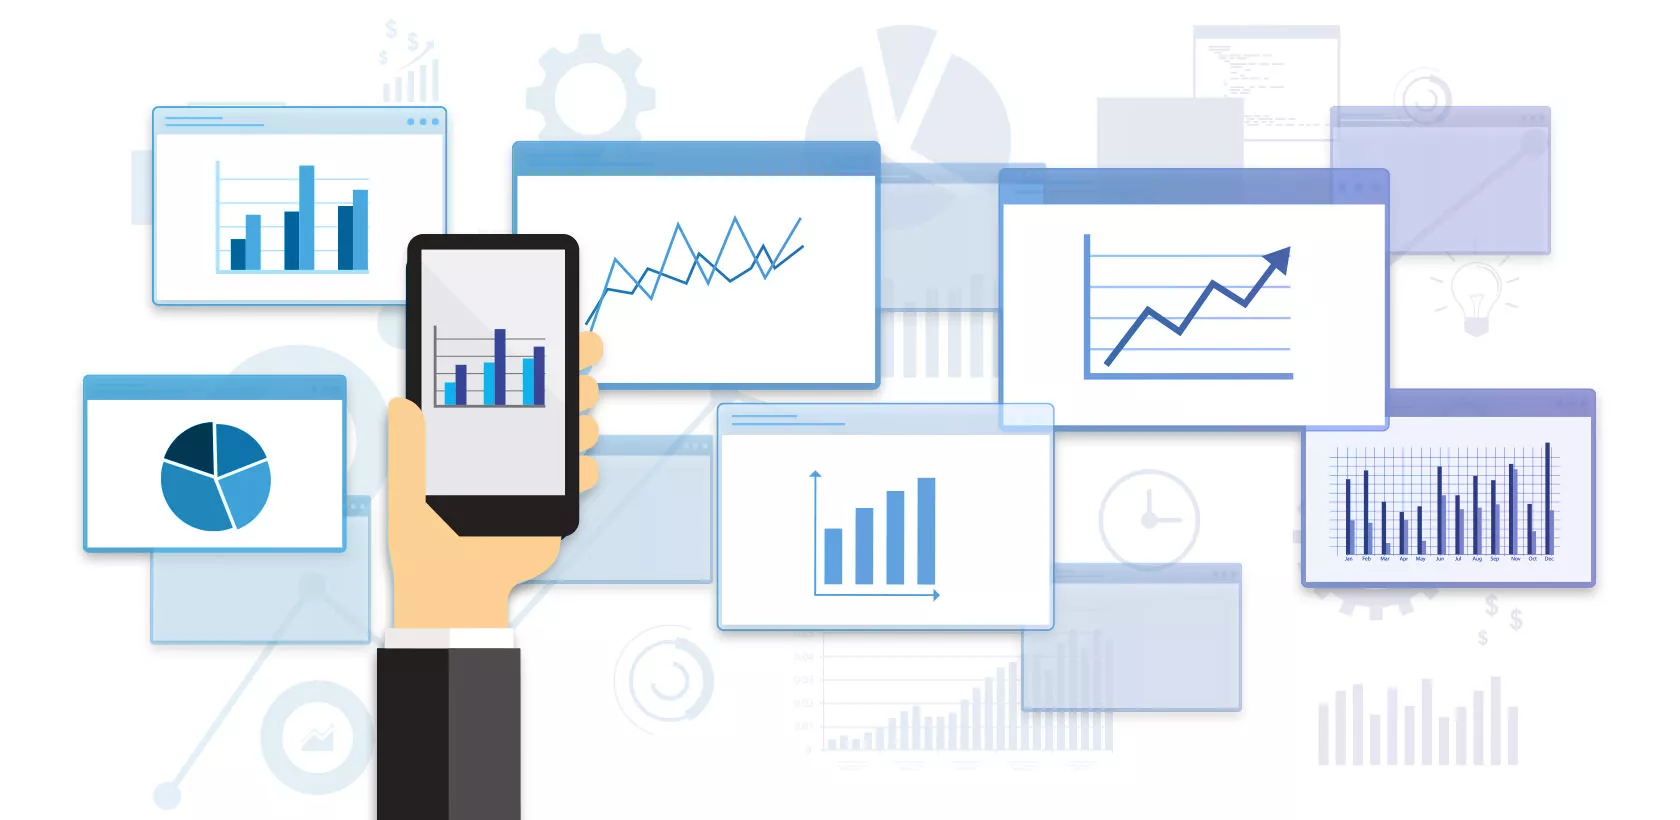
Financial tables, sales growth, and trends: mobile BI applications guaranty fast access to all relevant sources of data within an enterprise, and they deliver innovative dashboards too. Mobile BI services provide graphical visualizations that users always have on hand, to present as needed.
Visual analytics for diverse terminals
Information and Numbers on your Fingertips with Mobile BI
Mobile BI services can be deployed in numerous ways. Although smartphone and tablet technologies are constantly advancing, they do not impact the underling principals of visual data discovery. The needs of the target audience or user group are incorporated in the design process. In turn, professional mobile reporting systems pose another kind of challenge for report developers and designers: accounting for the terminal (target device). Developers must certainly consider the host of mobile devices for which reports and analyses have to be prepared. As for conventional and mobile reports, the purpose is still to enthuse users with intuitive handling – rather than frustrating them with gadgets or an overly static presentation. Hence, one must achieve a balance between innovation and traditional reporting skills.
Mobile BI service demands a revamped security concept
There’s no doubt that the ability to access all reports at any time with a mobile BI system opens up new possibilities and freedoms. However, one of the most crucial aspects to incorporate when launching a mobile BI service is – information security. Guaranteeing such security calls for rethinking and adapting the security concepts for mobile terminals. This is the only way your enterprise can protect in-house data/information from being lost via smartphones and tablets.
This situation also entails setting up rules governing access to the data. Also, since storage space on mobile devices is limited, it should still be possible to ensure adequate access for slow connections too.
b.telligent – Your Visual Analytics Guide
Our portfolio of consulting services includes setting up visual analytics systems, department-specific analysis & visualization applications, and self-service BI programs. We would gladly assist your enterprise to select the right mobile BI program, and devise a customized security concept. We can help you find the best product, implement the system, and set up hosting of mobile BI applications.
Feel free to make an appointment for a quick check-up, or to hold a workshop. Based on your particular data and reporting situation, we can conceive custom concepts and actions to improve visualization of data in your enterprise.


